Getting Started: MuleSight Diagnostics
What This Tab Answers
Section titled “What This Tab Answers”- Is the connected app fully usable for each MuleSight dataset?
- Which endpoints are returning
403, timing out, or failing for other reasons? - Which OAuth scopes are effectively
full,partial, ornonebased on probe outcomes?
Where to Open
Section titled “Where to Open”MuleSight Dashboard -> MuleSight Diagnostics
Guided Flow
Section titled “Guided Flow”Step 1: Run diagnostics for your current org + environments
Section titled “Step 1: Run diagnostics for your current org + environments”Open the Diagnostics tab and click Refresh Diagnostics for a live probe run.
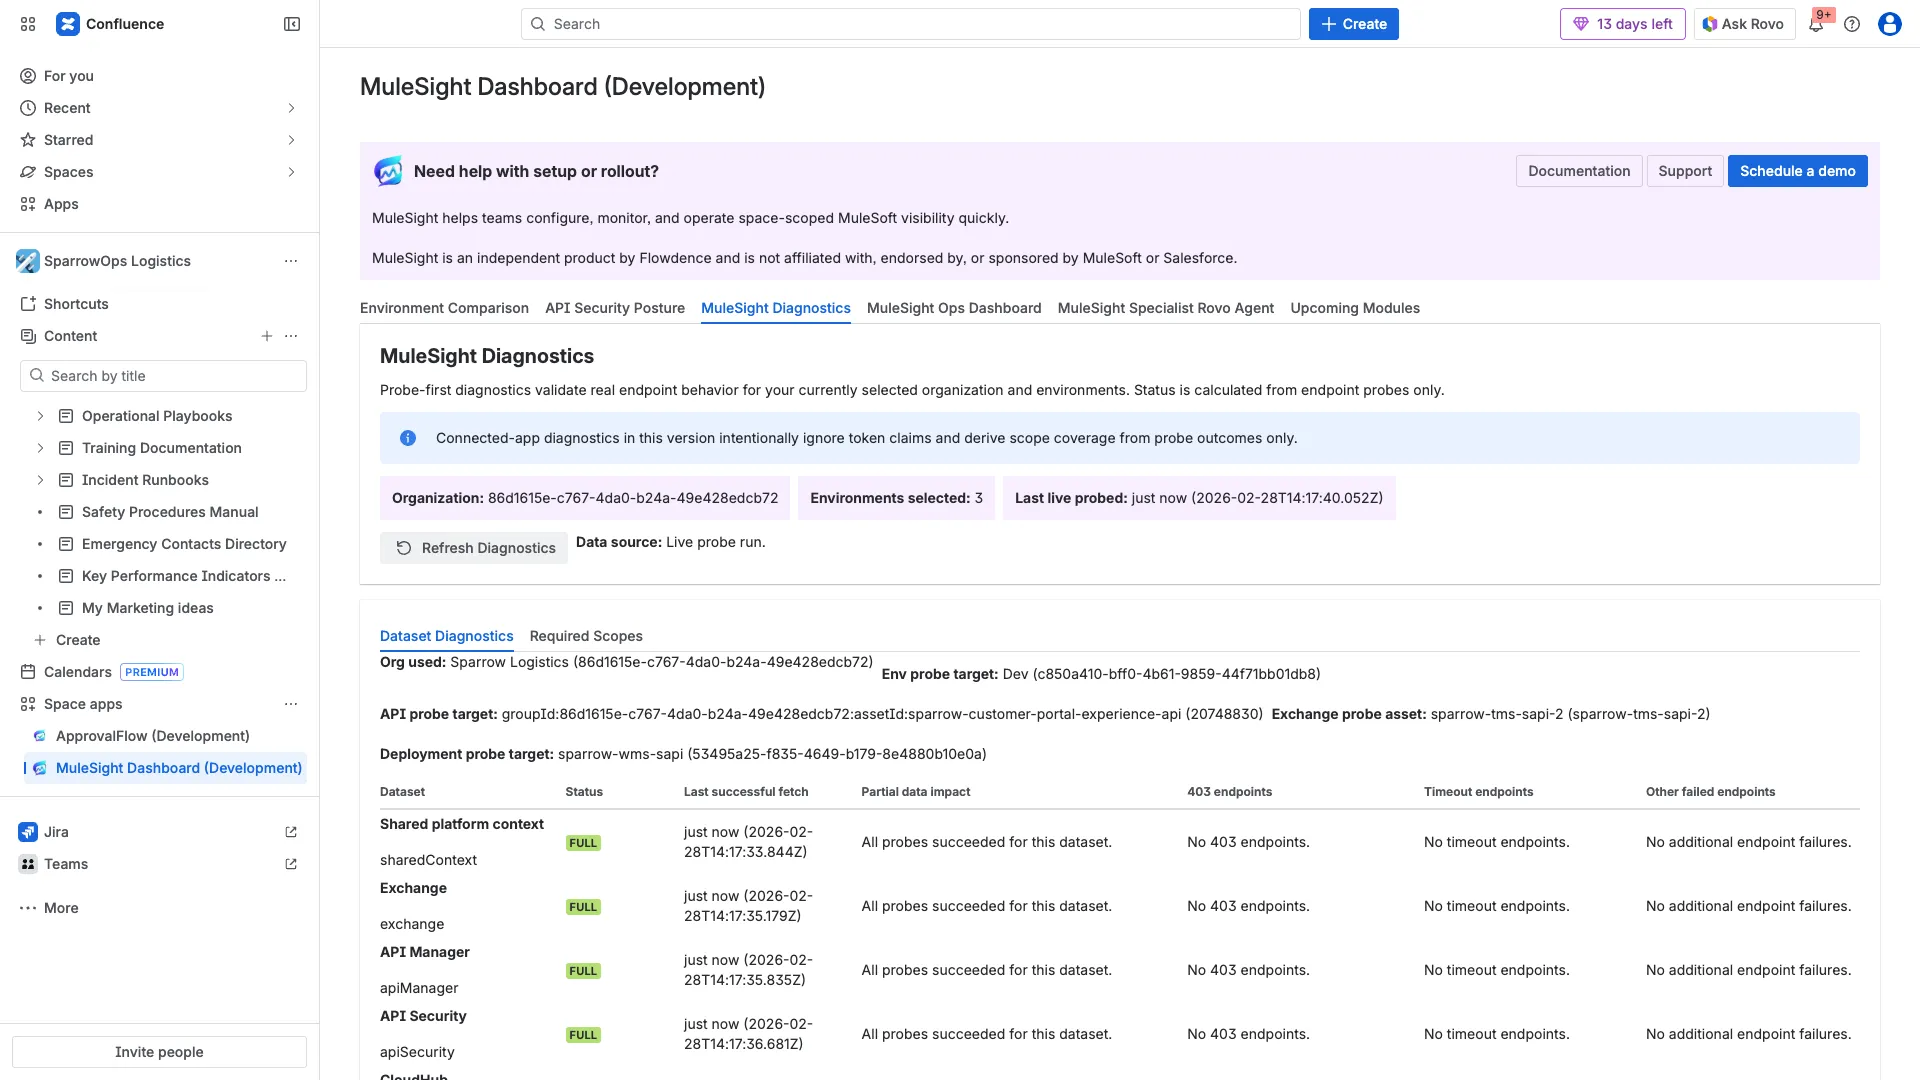
Step 2: Review dataset-level outcomes
Section titled “Step 2: Review dataset-level outcomes”Use Dataset Diagnostics to check each dataset status and the endpoint failure buckets:
403 endpointsTimeout endpointsOther failed endpoints
If all probes in a dataset succeed, it appears as FULL.
Step 3: Switch to required scopes impact view
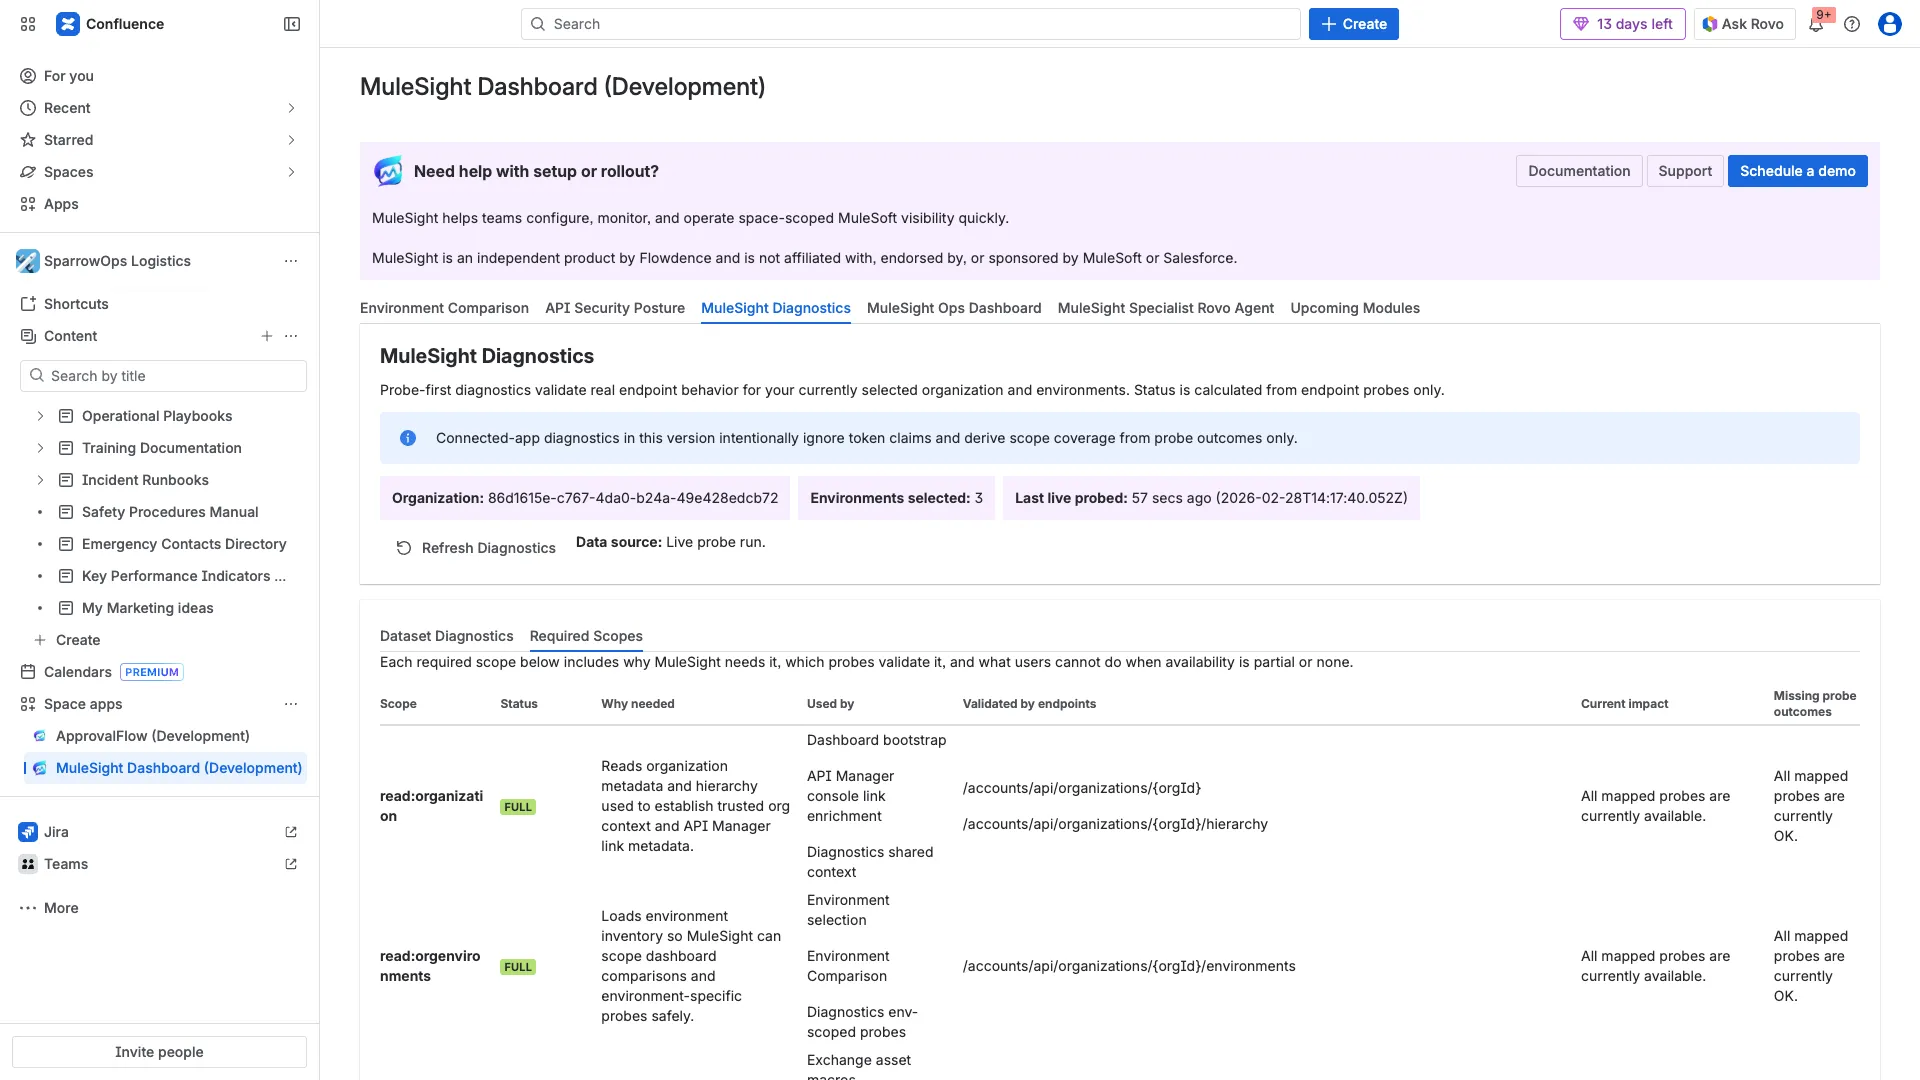
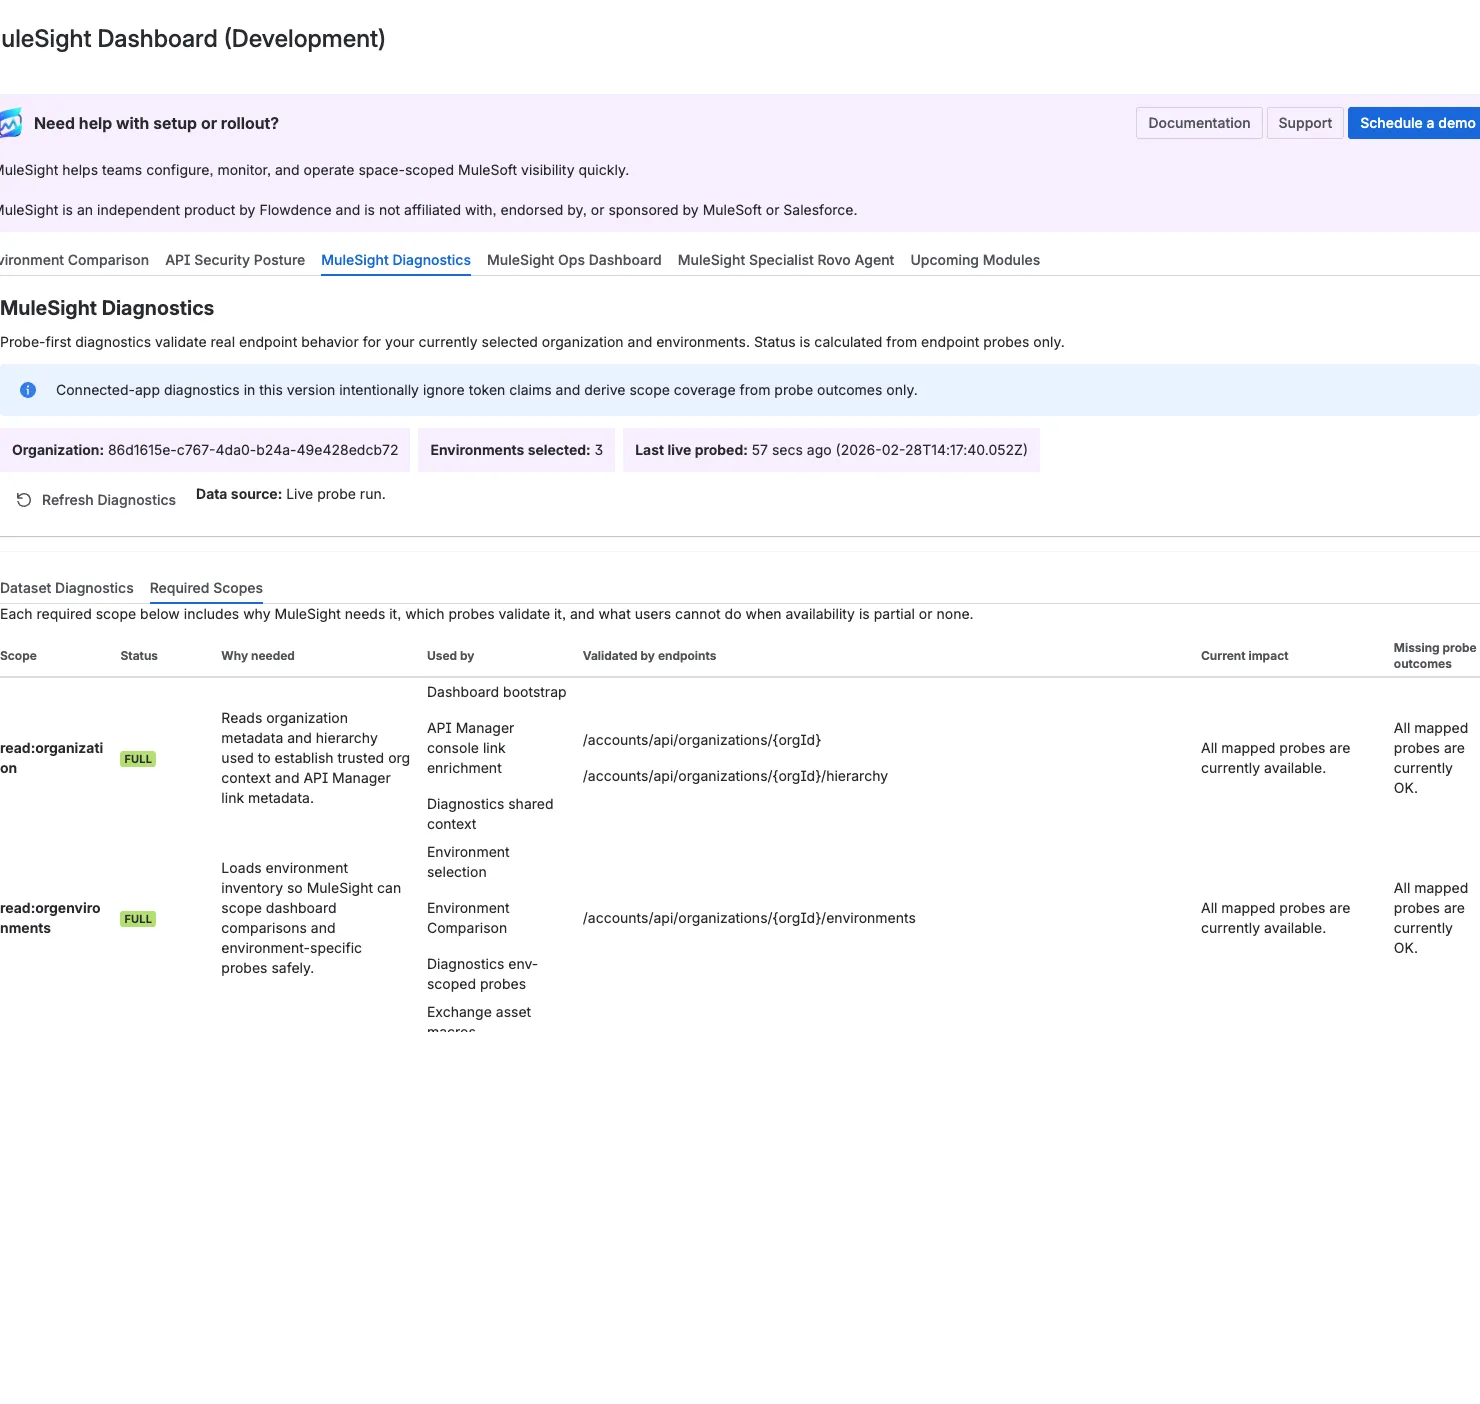
Section titled “Step 3: Switch to required scopes impact view”Open the Required Scopes subtab to see scope-by-scope impact and endpoint mappings.
Step 4: Apply configuration changes based on impact
Section titled “Step 4: Apply configuration changes based on impact”When a scope is partial or none, update your MuleSoft connected app and then refresh diagnostics again.
Status Interpretation
Section titled “Status Interpretation”Full: all mapped probes for that scope/dataset succeeded.Partial: mixed outcomes (for example, some probes succeed while others are skipped/timeout/forbidden).None: no mapped probe succeeded and at least one mapped probe is auth-blocked (401/403).
Video (Full)
Section titled “Video (Full)”Download full video: Diagnostics refresh and scope outcomes
Download clipped video: Diagnostics quick clip